
A variety of plotting capabilities. [source]
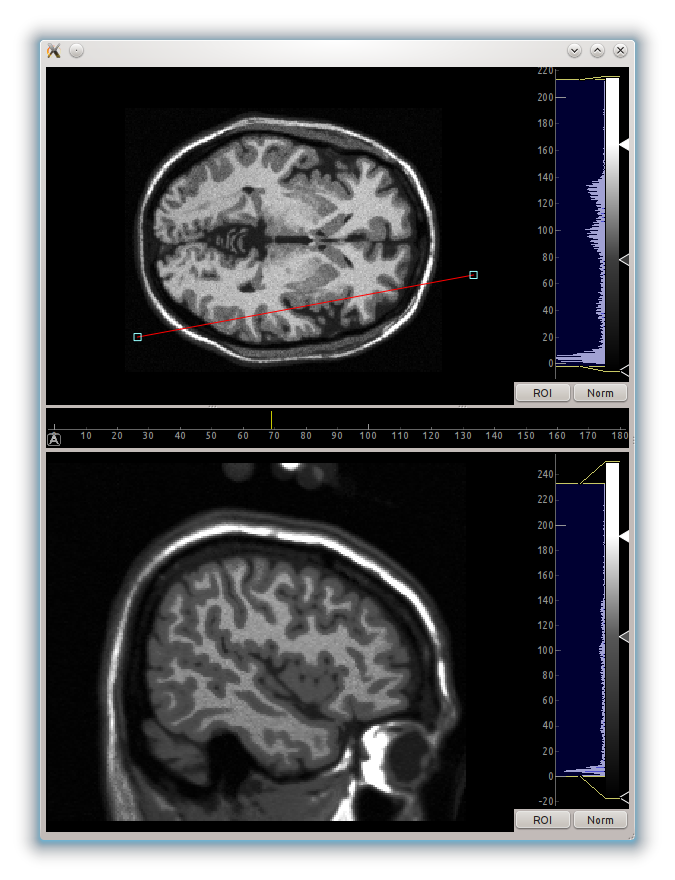
Image analysis with automated data slicing.

3D graphics: volumetric rendering, surface plots, scatter plots, and isosurfaces.

A variety of Region of Interest (ROI) types. Each ROI selects data from the underlying image and redisplays it below. [source]

Programmable flowcharts for fast prototyping.
For an example of PyQtGraph in use (and more screenshots), see ACQ4
PyQtGraph
Scientific Graphics and GUI Library for Python
Install from PyPI:
pip install pyqtgraphor via conda:
conda install -c conda-forge pyqtgraphor from source on GitHub:
    git clone https://github.com/pyqtgraph/pyqtgraph
    cd pyqtgraph
    pip install .
recent changes - older releases
PyQtGraph is a pure-python graphics and GUI library built on
PyQt
/ PySide and
numpy. It is intended for use in
mathematics / scientific / engineering applications. Despite being
written entirely in python, the library is very fast due to its heavy
leverage of NumPy for number crunching and
Qt's GraphicsView framework
for fast display. PyQtGraph is distributed under the
MIT open-source license.
Main Features
Basic 2D plotting in interactive view boxes
- Line and scatter plots
- Data can be panned/scaled by mouse
- Fast drawing for realtime data display and interaction
- Displays most data types (int or float; any bit depth; RGB, RGBA, or luminance)
- Functions for slicing multidimensional images at arbitrary angles (great for MRI data)
- Rapid update for video display or realtime interaction
- Volumetric data rendering
- 3D surface and scatter plots
- Mesh rendering with isosurface generation
- Interactive viewports rotate/zoom with mouse
- Basic 3D scenegraph for easier programming
- Interactively mark vertical/horizontal locations and regions in plots
- Widgets for selecting arbitrary regions from images and automatically slicing data to match
- 2D graphics use Qt's GraphicsView framework which is highly capable and mature.
- 3D graphics use OpenGL
- All graphics use a scenegraph for managing items; new graphics items are simple to create.
-
Flowchart widget for interactive prototyping.
Interface similar to LabView (nodes connected by wires). -
Parameter tree widget for displaying/editing hierarchies of
parameters
(similar to those used by most GUI design applications). -
Interactive python console with exception catching.
Great for debugging/introspection as well as advanced user interaction. - Multi-process control allowing remote plotting, Qt signal connection across processes, and very simple in-line parallelization.
-
Dock system allowing the user to rearrange GUI components.
Similar to Qt's dock system but a little more flexible and programmable. - Color gradient editor
- SpinBox with SI-unit display and logarithmic stepping
Requirements
PyQtGraph is known to run on Linux, Windows, and OSX.
It should, however, run on any platform which supports the following packages:
It should, however, run on any platform which supports the following packages:
- Python 3+
- PyQt 5, PyQt6, PySide2, or PySide6
- NumPy
- SciPy is optional for some numerical procedures
- python-opengl bindings are required for 3D graphics
Documentation
Packaging for Distribution
Applications written with pyqtgraph may be packaged as Windows exe
files using py2exe or OSX dmg files using py2app.
Questions, feedback, and bug reports
- Post bug reports and feature requests to the GitHub issue tracker.
- For questions, there are several options:
Comparison to other python graphics packages
Matplotlib is more or less the de-facto standard plotting
library for python. If you are starting a new project and do not
need any of the features specifically provided by pyqtgraph, you
should start with matplotlib. It is much more mature, has an
enormous user community, and produces very nice publication-quality
graphics.
VisPy is a new 2D/3D visualization library based on OpenGL that is developed as a collaboration between the authors of PyQtGraph, VisVis, Galry, and Glumpy. It is presently in early development and has a narrower scope than PyQtGraph--it will focus on visualization without the GUI toolkit features provided by PyQtGraph. In the long term, we hope VisPy will be able to replace Qt as the rendering engine for 2D graphics, and replace the pyqtgraph.opengl 3D system entirely. More about VisPy here.
PyQwt has a very nice set of features and is fast enough for realtime work. Its main drawback is that it is currently unmaintained and can be difficult to get working on a variety of platforms. Hopefully in the future it may find a new maintainer, but until then it may be best to avoid PyQwt (the original PyQwt maintainer is currently recommending to use pyqtgraph instead; check their mailing lists for updates). Like matplotlib, PyQwt lacks some of the more advanced features of pyqtgraph. Chaco is a very interesting project--nice graphics, good speed, and actively developed. Like PyQwt, however, Chaco can be challenging to install on a wide variety of platforms and lacks some of pyqtgraph's more advanced features (although pyqtgraph certainly lacks many of Chaco's features as well). GuiQwt is an interesting project with many advanced features similar to pyqtgraph. It is presently based on PyQwt and thus comes with some of its drawbacks, although there appear to be plans to change this in the future.
Reasons you might want to use pyqtgraph instead:
- Speed. If you are doing anything requiring rapid plot updates, video, or realtime interactivity, matplotlib is not the best choice. This is (in my opinion) matplotlib's greatest weakness.
- Portability / ease of installation. PyQtGraph is a pure-python package, which means that it runs on virtually every platform supported by numpy and PyQt, no compiling required. If you require portability in your application, this can make your life a lot easier.
- Many other features--pyqtgraph is much more than a plotting library; it strives to cover many aspects of science/engineering application development with more advanced features like its ImageView and ScatterPlotWidget analysis tools, ROI-based data slicing, parameter trees, flowcharts, multiprocessing, and more.
VisPy is a new 2D/3D visualization library based on OpenGL that is developed as a collaboration between the authors of PyQtGraph, VisVis, Galry, and Glumpy. It is presently in early development and has a narrower scope than PyQtGraph--it will focus on visualization without the GUI toolkit features provided by PyQtGraph. In the long term, we hope VisPy will be able to replace Qt as the rendering engine for 2D graphics, and replace the pyqtgraph.opengl 3D system entirely. More about VisPy here.
PyQwt has a very nice set of features and is fast enough for realtime work. Its main drawback is that it is currently unmaintained and can be difficult to get working on a variety of platforms. Hopefully in the future it may find a new maintainer, but until then it may be best to avoid PyQwt (the original PyQwt maintainer is currently recommending to use pyqtgraph instead; check their mailing lists for updates). Like matplotlib, PyQwt lacks some of the more advanced features of pyqtgraph. Chaco is a very interesting project--nice graphics, good speed, and actively developed. Like PyQwt, however, Chaco can be challenging to install on a wide variety of platforms and lacks some of pyqtgraph's more advanced features (although pyqtgraph certainly lacks many of Chaco's features as well). GuiQwt is an interesting project with many advanced features similar to pyqtgraph. It is presently based on PyQwt and thus comes with some of its drawbacks, although there appear to be plans to change this in the future.
[Please reach out on the
PyQtGraph Mailing list
if any of this information is outdated.]